
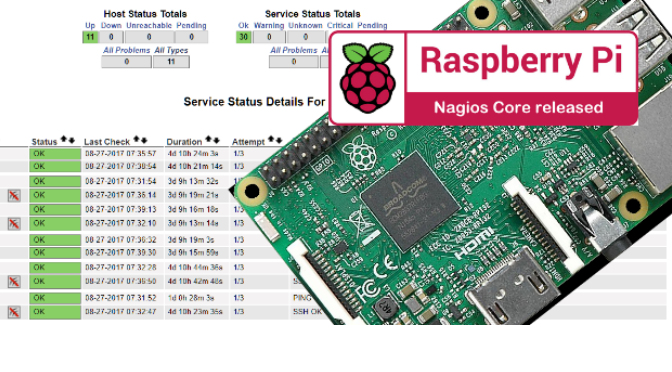
How to Install Nagios on Raspberry Pi
Nagios Open-Source IT infrastructure Monitoring
Nagios consists of a collection of modules for monitoring networks, hosts and their specific services, as well as a web interface to display queries of the collected data. It is under the GNU GPL, so it is free software and runs on numerous Unixoid operating systems. Because of its widespread use, Nagios has become a quasi-standard in professional use.
Nagios Monitoring with Raspberry Pi

Raspberry Pi with its fanless design, minimal dimensions and low power consumption , well suited as a single-board computer for a Nagios monitoring server that can even monitor itself.
INSTALLATION
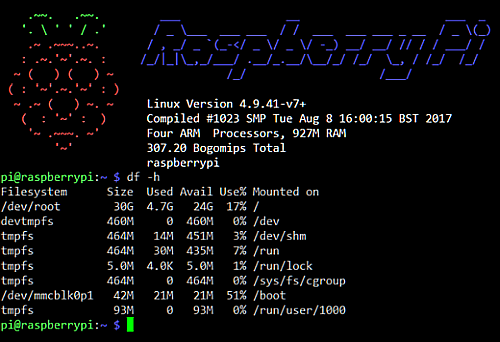
The installation of Nagios Core 4 on the Raspberry’s own OS Raspbian, which is based on Debian, is unspectacular. Here in these instructions the procedure for a Raspberry Pi 3 Model B is shown, on a 32 GB microSD card type Class 10, a 16 GB microSD card would also suffice.
SanDisk Ultra SDHC I 16 GB – 80 /Sek, Class 10 microSD Card.
The provision of Raspbian on a microSD card is not discussed here in more detail. After booting a Raspbian desktop image, the LXTerminal is opened on the Raspbian X desktop and the root shell is started, in headless operation a VNC session can be started with VNCViewer, with the login as user pi and the default password raspberry. If you want to use the Raspbian Minimal Image, authentication via SSH to the Raspberry Pi is recommended.
After logging in as user pi, we want to become root.
pi@raspberrypi:~ $ sudo suFirst, all required packages are installed from the repository as a prerequisite.
$ apt-get update
$ apt-get install -y autoconf gcc libc6 make wget unzip apache2 apache2-utils php5 libgd2-xpm-dev
Download and unzip the Nagios Core 4 source packages. The last release can be found here. The core release as well as the agents and plugins are available on Github.
$ cd /tmp
$ wget -O nagioscore.tar.gz https://github.com/NagiosEnterprises/nagioscore/archive/nagios-4.4.3.tar.gz
$ tar xzf nagioscore.tar.gz
Compilie
$ cd /tmp/nagioscore-nagios-4.4.3
$ ./configure --with-httpd-conf=/etc/apache2/sites-enabled
$ make all
Create the user nagios and the group. The Apache user www-data is also added to the nagios group.
$ useradd nagios
$ usermod -a -G nagios www-data
Install the binaries.
$ make installInstalling the service daemon files and configuring them for the boot process.
$ make install-init
$ systemctl enable nagios.service
Installs and configures the external command file.
$ make install-commandmodeJust now * SAMPLE * configuration files will be installed. These are necessary because Nagios needs some configuration files to start.
$ make install-config
Apache web server configuration files are installed and the Apache settings for Nagios are configured.
$ make install-webconf
$ a2enmod rewrite
$ a2enmod cgi
Port 80 must be permitted for incoming data traffic on the local firewall so that the Nagios Core web interface can be reached.
$ iptables -I INPUT -p tcp --destination-port 80 -j ACCEPT
$ apt-get install -y iptables-persistent
Answer yes to save the existing rules.
An Apache user account is created so that it can log into Nagios.
The following command creates a user account called nagiosadmin and a password is created for the account, now remember this password.
$ htpasswd -c /usr/local/nagios/etc/htpasswd.users nagiosadminThe Apache web server must be restarted.
$ systemctl restart apache2.serviceNagios Core will now start.
$ systemctl start nagios.serviceNagios is now ready to be tested.
https://10.10.10.84/nagios/You will be asked to log in with your user name and password. The username is nagiosadmin (you created it in a previous step) and the password is what you provided earlier.
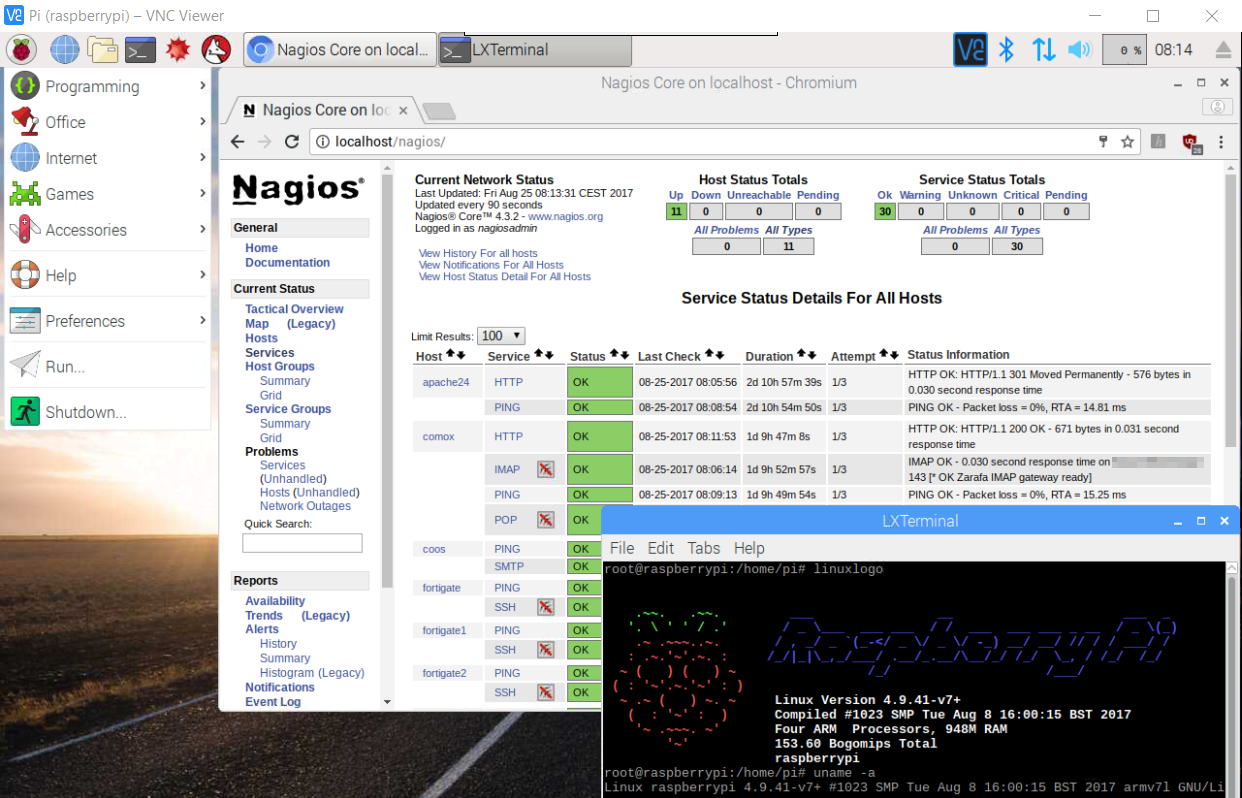
After successfully logging in, the Nagios Core web interface appears. Congratulations, you did it.
Nagios Core is now installed, the Nagios plugins are still required for operation. The error message appears: (No output on stdout) stderr: execvp(/usr/local/nagios/libexec/check_load .. this is normal, the standard plugins are installed in the following steps.
Plugin Installation
The following packages are installed from the repository as a prerequisite for installing the plugins.
$ apt-get install -y autoconf gcc libc6 libmcrypt-dev make libssl-dev wget bc gawk dc build-essential snmp libnet-snmp-perl gettextDownload and extract the source packages. The last plugin releases can get from nagios-plugins.org.
$ cd /tmp
$ wget --no-check-certificate -O nagios-plugins.tar.gz https://github.com/nagios-plugins/nagios-plugins/archive/release-2.2.1.tar.gz
$ tar zxf nagios-plugins.tar.gz
Compile and install packages.
$ cd /tmp/nagios-plugins-release-2.2.1/
$ ./tools/setup
$ ./configure
$ make
$ make install
Go to a host or service object and “Re-schedule the next check” in the Commands menu. The error that appeared before should now disappear and the correct output is displayed on the screen .
The daemon commands for start / stop / restart / status.
$ systemctl start nagios.service
$ systemctl stop nagios.service
$ systemctl restart nagios.service
$ systemctl status nagios.service
Nagios configuration
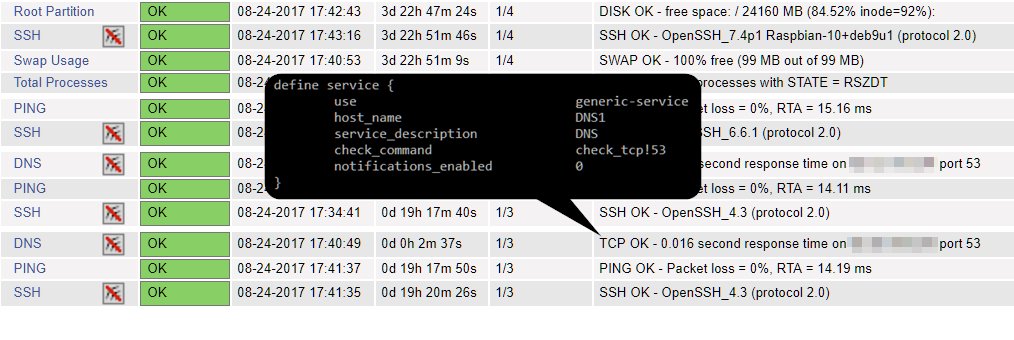
Now that the Nagios Core Server is ready for operation, it is time to create the configuration of the host and services that are to be monitored. Under /usr/local/nagios/etc the main configuration is nagios.cfg, here the paths to the configuration files are defined with cfg_file, the hosts to be monitored can be entered in a file hosts.cfg.
## Default Linux Host Template ##
define host{
name                            linux-box               ; Name of this template
use                             generic-host            ; Inherit default values
check_period                    24x7
check_interval                  5
retry_interval                  1
max_check_attempts              10
check_command                   check-host-alive
notification_period             24x7
notification_interval           30
notification_options            d,r
contact_groups                  admins
register                        0                       ; DONT REGISTER THIS - ITS A TEMPLATE
}
## Default
define host{
use                             linux-box               ; Inherit default values from a template
host_name                       Diskstation             ; The name we're giving to this server
alias                           Synology                ; A longer name for the server
address                         10.10.10.88             ; IP address of Remote Linux host
}
If it is to be more structured, there is the possibility to save the host and service configuration in the directories printers, routers, servers, switches, for this the file nagios.cfg is edited and the comment characters # (hash) are removed accordingly in cfg_dir = .
$ vi /usr/local/nagios/etc/nagios.cfg
..
# Definitions for monitoring a Windows machine
cfg_file=/usr/local/nagios/etc/objects/windows.cfg
The .cfg files created in the directories are read out.
Example for a mail and web server with this IMAP and HTTPS is checked.
define host {
        use                             linux-server
        host_name                       mailserver
        alias                           Exchange
        address                         10.10.10.15
        max_check_attempts              5
        check_period                    24x7
        notification_interval           30
        notification_period             24x7
}

define service {
        use                             generic-service
        host_name                       mailserver
        service_description             PING
        check_command                   check_ping!100.0,20%!500.0,60%
}

define service {
        use                             generic-service
        host_name                       mailserver
        service_description             HTTPS
        check_command                   check_tcp!443 -H 10.10.10.15 -u https://owa.banana.org
        notifications_enabled           0
}

define service {
        use                             generic-service
        host_name                       mailserver
        service_description             IMAP
        check_command                   check_imap
        notifications_enabled           0
}
The Nagios server is restarted after each change.
$ systemctl restart nagios.serviceA look at the Nagios log file can be worthwhile.
$ tail -30 /usr/local/nagios/var/nagios.logAdditional configuration examples for Linux, Windows, printer routers and switches can be found under the objects directory .
With remote agents such as NCPA, active checks can be carried out on Windows and Linux hosts; passive checks can be carried out using NRDP and NRPE, which provide values on CPU load, memory usage, processes, user and disk usage.
Nagios Notification
In the file nagios.cfg and objects/contacts.cfg the recipient email root@localhost can be left.
$ vi /usr/local/nagios/etc/objects/contacts.cfg

define contact{
        contact_name                    nagiosadmin             ; Short name of user
        use                             generic-contact         ; Inherit default values from generic-contact$
        alias                           Nagios Admin            ; Full name of user

        email                           root@localhost          ; <<***** CHANGE THIS TO YOUR EMAIL ADDRESS *$
        }
In the file nagios.cfg at admin_email .
$ vi /usr/local/nagios/etc/nagios.cfg
..
admin_email=root@localhost
Postfix is used here as the mail transport agent for the Nagios email notification. This is installed and configured as follows .
$ sudo apt-get -y install postfixDuring the installation you will be asked to select a mail server configuration, here we select Internet Site .
In order to be able to test the sending of emails later, the package mailutils is installed.
$ sudo apt-get -y install mailutilsThe Postfix main configuration main.cf is adapted .
$ vi /etc/postfix/main.cf
..
relayhost = mailserver.banana.org
At relayhost, the mail server is entered that allows Raspberry Pi to receive emails, if the Raspberry is behind a firewall with NAT, the public IP address of the mail server must be authorized for reception.
Set up an email address for root by editing the aliases file .
$ vi /etc/aliases
..
root:  helpdesk@banana.org
At the end a valid email address is entered so that mails from this host are delivered, here as an example it is helpdesk@banana.org, the colon for root: is mandatory.
The changes in the aliases file must still generate the aliases.db file .
$ newaliasesThe Postfix configuration also has to be read in and activated.
$ postfix reloadNow sending emails from Raspberry Pi, this can be done as follows.
$ echo "hello from raspberry pi" | mail -s hello rootAn email should now be in the inbox of helpdesk@banana.org.
Read the email log can also provide further information here.
$ tail /var/log/mail.logIf the attempt to send returns the status=bounced , receipt on the mailer is not yet authorized. With Exchange, the IP address of the Raspberry Pi must be entered in the receive connector in the frontend transport under area definition for email received from servers with these remote IP addresses. For Postfix a smtpd_client_restrictions directive must exist in main.cf .
smtpd_client_restrictions =
smtpd_recipient_restrictions =
        check_client_access hash:/etc/postfix/client_access,
client_access file contains the IP address of the Raspberry Pi .
# Raspberry Pi Nagios
10.10.10.84    ok
Postfix database still needs to be generated.
$ postmap /etc/postfix/client_accessIf the SMTP requests are accepted by the mailer, the queue process and delivery can take place.

