

Network Connections can be continuously monitored using netstat and ss

Netstat – derived from Network Statistics, is a command-line utility used by system administrators to track or analyze network statistics. It displays a whole range of statistics, such as open ports and corresponding addresses on the host system, route table and masked connections.
This tutorial shows how “netstat” and “ss” can be used to monitoring current network connections they tracking in near real time on Linux.
Install net-tools to use netstat
On many modern Linux distributions, netstat is replaced by the new ss utility, if it is not pre-installed, netstat can be installed afterwards. The package that contains netstat is net-tools.
$ yum install net-tools     [CentOS/RHEL]
$ apt install net-tools     [Debian/Ubuntu]
Track Network Connections using netstat
The netstat command runs through filters so that only the remote addresses are displayed, and with the watch command it is carried out continuously at intervals. The output shows the network statistics and connection tracking in real time of current https requests on a web server.
$ watch -n 5 "netstat -nt | grep :443 | tail -n +3 | awk '{print \$5}' | cut -d: -f1 | sort | uniq -c | sort -n"Here the remote addresses are showing at an interval of 5 seconds for requests via https (TCP port 443).
SMTP connection tracking
If you want to track the current requests of an SMTP relay, port 25 is filtered out and then refresh every 10 seconds.
$ watch -n 10 "netstat -nt | grep :25 | tail -n +3 | awk '{print \$5}' | cut -d: -f1 | sort | uniq -c | sort -n"Basically, the interval check is possible with any service, any ports and interval times in seconds can be selected.
Watch IPv6 network connections
The connections can also be watching using the new command-line utility, the ss command stand for – another utility to investigate sockets. Basically it directly queries the kernel and can respond much faster than netstat.
$ watch -n 3 "ss -nH | grep :443 | awk '{print \$6}' | sort | uniq -c | sort -n"The tail and cut filters are no longer used here, as the ss utility has its own filter operators.

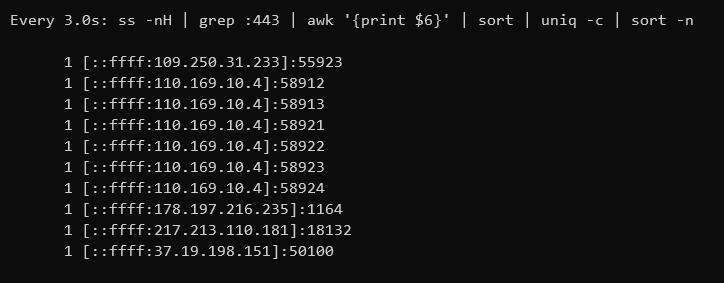
The connections for IPv4 and for IPv6 are displayed, each with an IPv4-as-IPv6 address followed by peer source port.
MultiTail advanced features along with SS
Using multitail there are other features. For example several commands can be divided into windows, as shown in the example with multitail.
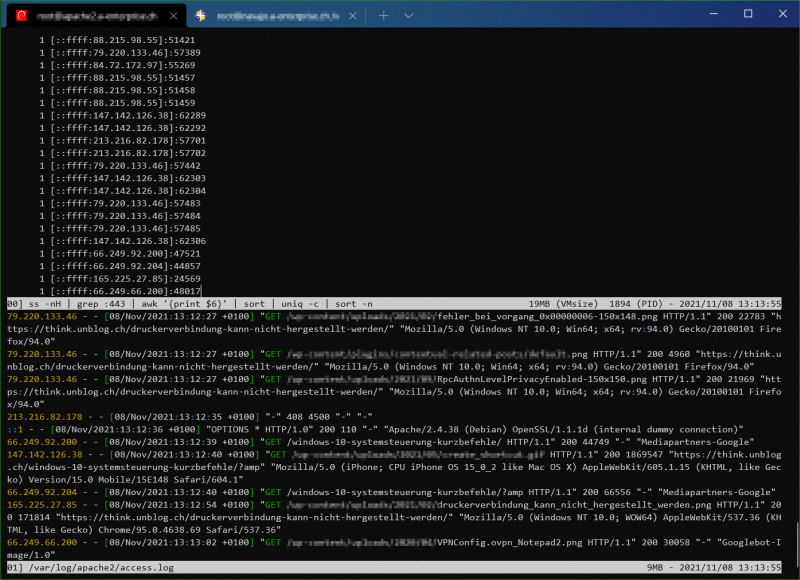
$ multitail -R 3 -l "ss -nH | grep :443 | awk '{print \$6}' | sort | uniq -c | sort -n" -cS apache /var/log/apache2/access.logThe output shows the apache.log together with connections on a Debian web server. Whereby multitail is split horizontally into two windows, -R 3 specifies the interval of 3 seconds, -l for the external command, here “ss -nH” Suppress header line. The command line tool can be deployed with “apt install multitail”.
netstat and ss network connections divided

Note. install multitail use sudo apt install multitail
Watching Network Connections in Realtime
Make your Linux terminal more useful with tmux, a terminal multiplexer that allows you to run multiple programs over a single ssh connection.
tmux offers some of the same functionality known from Screen, which has been deprecated in some Linux. tmux has a more modern code base than Screen and offers additional customization capabilities.
Install tmux
tmux is available in the standard repositories for Debian, Ubuntu or Fedora and many others.
$ sudo apt -y install tmuxGetting started tmux
To start using tmux, type tmux on your terminal. This command launches a tmux server, creates a default session (number 0) with a single window, and attaches to it.
$ tmuxNow that you’re connected to tmux, you can run any commands or programs as you normally would. You can disconnect your SSH connection at this point, and the command will continue to run. When you’re ready, reconnect to the server and reattach to the existing tmux session to resume where you left off.
Create a new tmux session
First, create a new tmux session if you’re not already in one. You can name your session by passing the parameter -s {name} to the tmux new command when creating a new session.
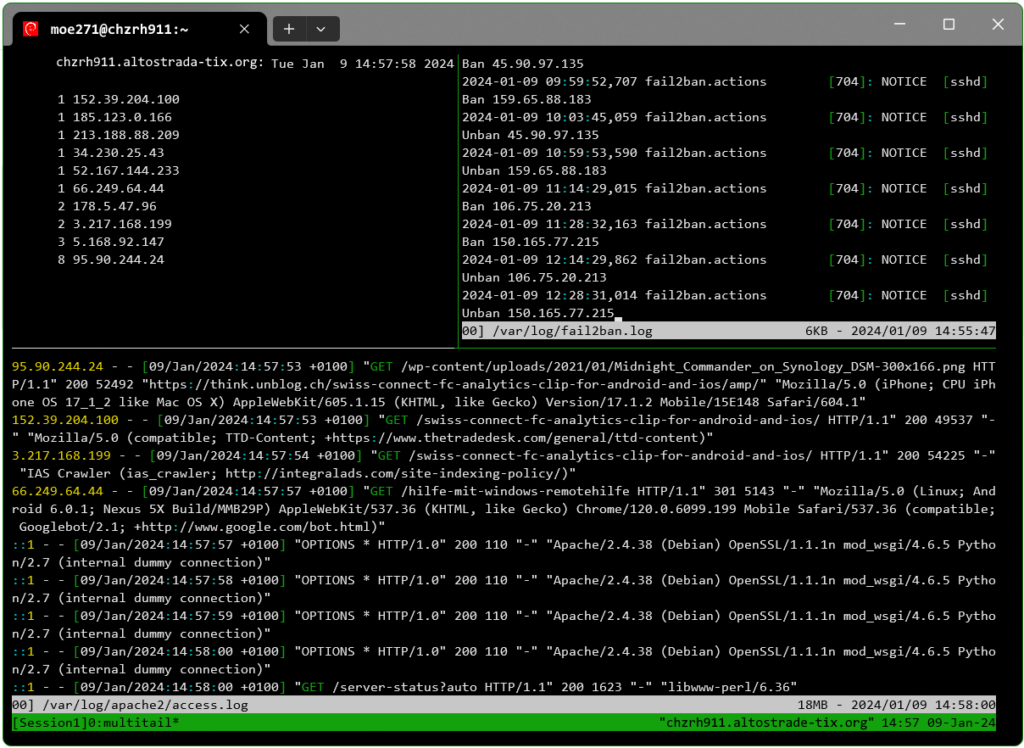
$ tmux new -s Session1Now press Ctrl+b " to split the window into two panes vertically.
Insert the command-line below using copy & pase into the bottom pane.
multitail -cS apache /var/log/apache2/access.logNext press Ctrl+b Arrow Key Up to move to the upper pane.
Insert the command-line below using copy & pase into the upper pane.
watch -n 5 "netstat -nt | grep :443 | tail -n +3 | awk '{print \$5}' | cut -d: -f1 | sort | uniq -c | sort -n"You now monitor the network connections in real time, in the top pane the connection using netstat, while in the bottom pane view the apache access log is scrolling. Divide it into a third area by pressing Ctrl+b % to Split the window into a third pane horizontally.

You can now leave the session with type Ctrl+b d to leave both sessions. Note. The commands continue to be running in the background.
If you want to continue with the observation, simply type tmux a and the two panes appear with the processes back again in the foreground.
tmux keybindings
- Ctrl+b d — Detach from the current session.
- Ctrl+b % — Split the window into two panes horizontally.
- Ctrl+b “ — Split the window into two panes vertically.
- Ctrl+b Arrow Key (Left, Right, Up, Down) — Move between panes.
- Ctrl+b x — Close pane.
- Ctrl+b c — Create a new window.
- Ctrl+b n or p — Move to the next or previous window.
- Ctrl+b 0 (1,2…) — Move to a specific window by number.
- Ctrl+b : — Enter the command line to type commands. Tab completion is available.
- Ctrl+b ? — View all keybindings. Press Q to exit.
- Ctrl+b w — Open a panel to navigate across windows in multiple sessions.
With tmux ls the active sessions are queried, which can then be resumed with tmux a (abbreviation of attach) and the session name.
$ tmux ls
Session1: 1 windows (created Mon Jan  8 20:49:02 2024) [154x40]
$ tmux a -t Session1
Conclusion
This tutorial discusses how the netstat utility can be used to periodically run the netstat command using watch. Network statistics and connections can be continuously tracked or monitored using netstat and ss. It is also important to point out that netstat is deprecated. Instead ss Utility has taken its place to display refined network statistics. It can also be said that the “older” netstat command has been replaced by both ss and some ip commands.
You might also be interested in the related post here.
