


Monitorix for powerful monitoring with system and network diagrams and graphs on Debian Linux. The open source lightweight tool regularly collects system and network data and displays the statistics in charts via its own web server in a browser web UI.
Monitorix enables monitoring of overall system performance and also helps detect bottlenecks, failures, unwanted delayed response times and other unusual activities.
Monitorix contains two programs: a collector as the program Monitorix, a Perl daemon that starts automatically as system service, and a CGI script called Monitorix.cgi.
Network diagrams with Monitorix in Debian
Monitorix is Open Soure and written in the Perl language and licensed under the GNU (General Public License) as published by the FSP (Free Software Foundation). The diagrams are created with the RRDtool and then displayed in a web UI.
The development of Monitorix is currently in an active state and new features are constantly being added. New charts and updates with bug fixes are offered for powerful monitoring for Debian and Linux system/network administration.
Monitorix Features
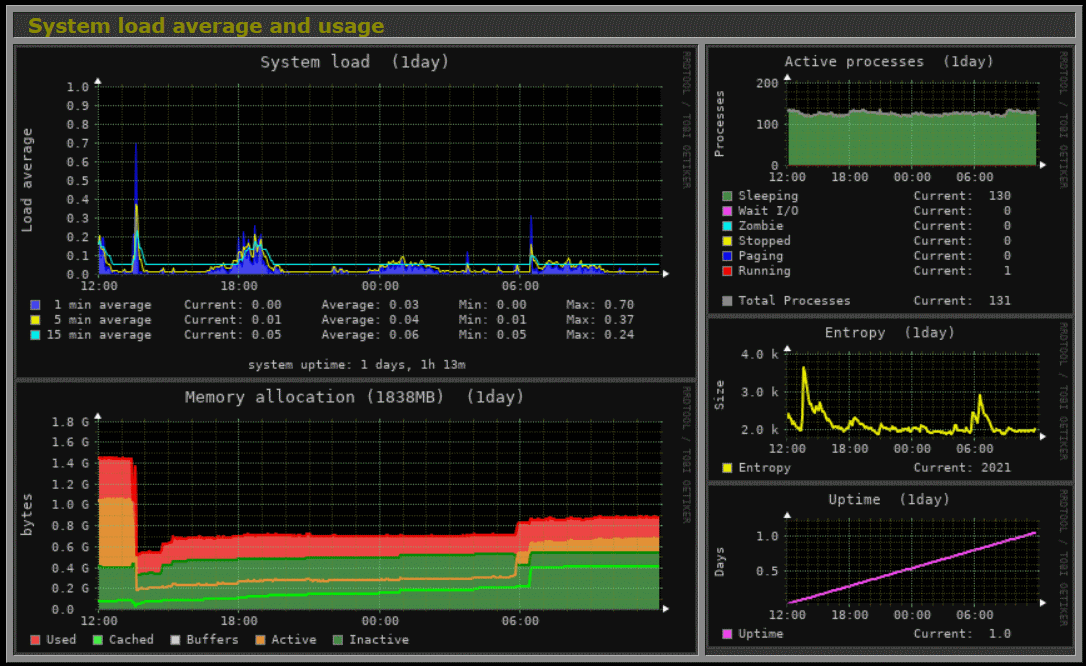
- Average system load, active processes, kernel usage per processor, global kernel usage and memory allocation.
- Monitors the temperatures and health of the hard drives.
- File system usage and file system I/O activity.
- Use of network traffic by up to 10 network devices.
- System services include SSH, FTP, VSFTPd, ProFTP, SMTP, POP3, IMAP, POP3, ClamAV and SpamAssassin.
- MTA mail statistics including incoming and outgoing connections.
- Network port traffic including TCP, UDP, etc.
- FTP statistics with log data from FTP servers.
- Apache statistics from local or remote servers.
- MySQL statistics from local or remote servers.
- Squid proxy web cache statistics.
- Fail2ban statistics in Monitorix network diagrams.
- Monitoring remote servers (multihost).
- Ability to view statistics in charts or in plain text tables by day, week, month or year.
- Ability to define the number of charts per line.
- Integrated HTTP server, Apache or Nginx is not mandatory.
- Running on Debian GNU/Linux, Ubuntu, Red Hat, Fedora, Rocky Linux, AlmaLinux, Arch Linux and many more.
Monitorix Installation
To install the latest version of Monitorix for Network Diagrams, the package is provided from the Debian repository.
$ sudo apt install monitorixAfter successful installation, the service can be started immediately. The system services to be monitored can be configured in the/etc/monitorix/monitorix.conffile to enable or disable and adding additional settings or charts.
For access control, a user with a password is created using htpasswd. If there is no Apache Web Server on the system, the “apache2-utils” package can be installed.
$ sudo apt install apache2-utilsAfter the package is deployed, htpasswd can be executed.
$ sudo htpasswd -d -c /var/lib/monitorix/htpasswd monitorix
New password:
Re-type new password:
Adding password for user monitorix
Now add the Monitorix service to the system startup and start the service with the following commands. For persistent set up Monitorix and network graphs on Debian Server.
$ sudo systemctl start monitorix.service
$ sudo systemctl enable monitorix.service
Checking for the status of the Monitorix service is as follows.
$ sudo systemctl status monitorix.serviceDebian Linux Firewall for Monitorix
Monitorix is listeing on port 8080, which the kernel firewall controls with iptables or ufw. The iptables command to open TCP port 8080 inbound is as follows.
$ sudo iptables -A IN_public_allow -p tcp --dport 8080 -m state --state NEW,UNTRACKED -j ACCEPTIf ufw (Uncomplicated Firewall) is used, ran this command.
$ sudo ufw allow 8080/tcp
A different port can also be defined, for example because TCP 8080 is already in use, or you want to take the system out of the focus of curious network scanners that are targeting established services.

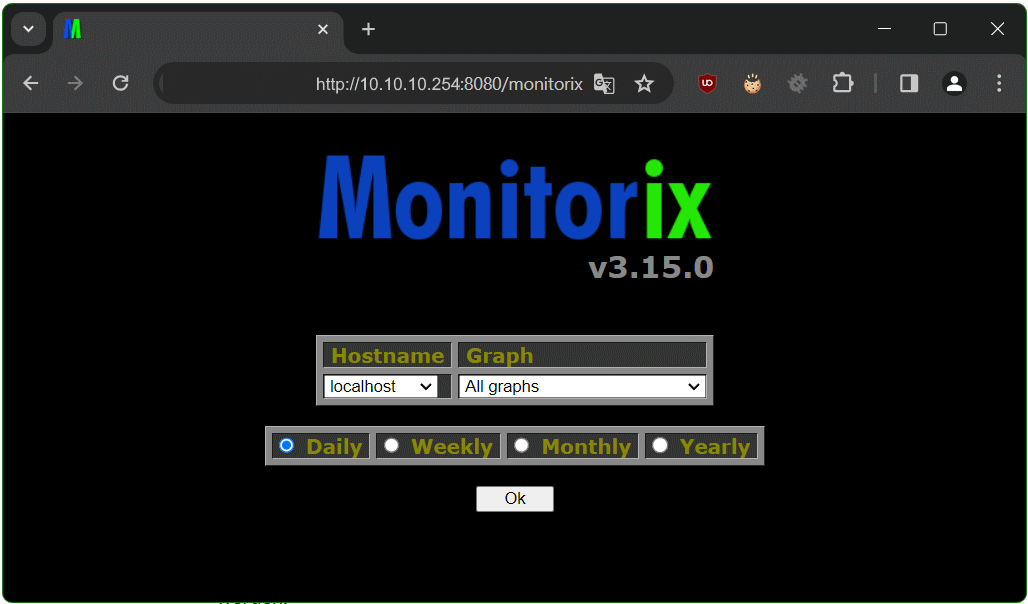
After Monitorix is started, the tool begins collecting system information for creating network diagrams according to the configuration specified in the /etc/monitorix/monitorix.conf file. After a few minutes, the diagrams will appear in the browser.
http://Server-IP:8080/monitorix/

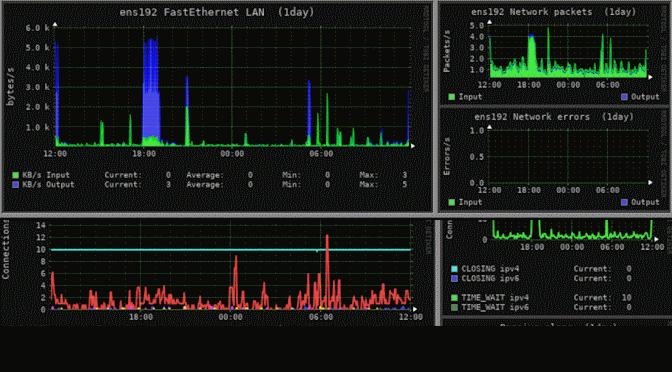
Monitorix System and Network Diagrams
After individual or all graphs have been selected, the Monitorix system and network diagrams appear after clicking OK.

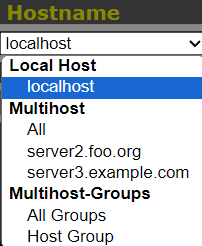
Monitorix on several servers using as Multihost
If you want to use Monitorix on multiple servers, the network remote statistics diagrams can be viewed centrally, this is called Multihost feature.
Let’s say we want to collect the statistics of two servers with Monitorix. I’ll call these server1 from which we want to view both server diagrams, the second server is server2, which delivers the statistics data to server1.
The configuration on server1 in themonitorix.conffile in<httpd_builtin>section is as follows.
<httpd_builtin>
        enabled = y
        host =
        port = 8080
        user = nobody
        group = nobody
        log_file = /var/log/monitorix-httpd
        hosts_deny = all
        hosts_allow = 127.0.0.1, 203.3.113.0/24, 10.10.10.10
        <auth>
                enabled = y
                msg = Monitorix: Restricted access
                htpasswd = /var/lib/monitorix/htpasswd
        </auth>
</httpd_builtin>
Server1: /etc/monitorix/monitorix.conf
The configuration on server2 is as follows.
<httpd_builtin>
        enabled = y
        host =
        port = 8080
        user = nobody
        group = nobody
        log_file = /var/log/monitorix-httpd
        hosts_deny = all
        hosts_allow = 127.0.0.1, 203.3.113.0/24, 10.10.10.10
        <auth>
                enabled = n
                msg = Monitorix: Restricted access
                htpasswd = /var/lib/monitorix/htpasswd
        </auth>
</httpd_builtin>
Server2: /etc/monitorix/monitorix.conf
As we can see, the only difference from server1 to server2 is the option enabled n or y in the <auth>section. This will allow us to log in to server1 and view the diagrams from server2 as well.
Next set the configuration of server1 in the<multihost>section.
<multihost>
        enabled = y
        footer_url = y
        graphs_per_row = 2
        remotehost_list = server2.foo.org, server3.example.com
        <remotehost_desc>
                0 = http://server2.foo.org:8080,/monitorix
                1 = http://203.3.113.3:8080,/monitorix
        </remotehost_desc>
        groups = y
        remotegroup_list = Host Group
        <remotegroup_desc>
                0 = server2.foo.org, server3.example.com
        </remotegroup_desc>
</multihost>
The Multihost feature is set to yes withenabled = y
Each servers in the subnet 203.3.113.0/24 are authorized to transmit data, and 10.10.10.10 is the client from which the statistics graphs can be viewed in the browser. Additional servers can also be added, like here server3.example.com [203.3.113.3] in the same subnet.
Now the remote server can be selected with the dropdown Hostname menu to view the Monitorix network diagrams from another Debian or any other Linux server.

Source Link: Monitorix
Conclusion
Monitorix is a powerful system and network resource monitoring system with graphs for Debian and most Linux distributions. Monitorix was originally designed for monitoring Red Hat, Fedora and CentOS Linux, but today it runs on different GNU/Linux distributions. The open source tool regularly collects system and network data and displays the information in diagrams via its own web server in a web UI. The lightweight program is also suitable for use on single-board computers such as Raspberry Pi.
