Windows Server 2019 users find that when searching in RDS, the search indexing on the terminal server do not work while searching in remote desktop and in Outlook.
Symptom
Windows Server 2019 users reported that searching in Remote Desktop on the Terminal Server and searching in Outlook doesn’t showing any search results. The status “Indexing is not running” is displayed in the indexing options.

After checking the search indexing service “services.msc”, it is shown that Windows Search is running on the RDS Server 2019. When trying to Rebuild the index under Advanced “Rebuild”, the indexing remains unsuccessful even after this action.
Cause
Starting with Windows Server 2019, Microsoft has made changes to the Windows Search service. The per-user search index is now enabled by default. This search indexing also applies to RDS and Windows Server 2022.
That’s why, as an administrator, you won’t see any locations under Indexing Options > Change > Show all locations.
Administrators can disable the setting and restore the older indexing method for Windows Server and RDS by using the EnablePerUserCatalog registry key:
HKEY_LOCAL_MACHINE\SOFTWARE\Microsoft\Windows Search
DWORD EnablePerUserCatalog 0
Solution: Search Indexing for RDS server
The traditional indexing option “per user search indexing” is restored with the following action.
To do this, open a command prompt on the windows server as an administrator and execute the following command to add the registry DRWOD key EnablePerUserCatalog with the value 0.
REG ADD "HKLM\SOFTWARE\Microsoft\Windows Search" /v "EnablePerUserCatalog" /t REG_DWORD /d "0" /fNow restart the “Windows Search” service or Reboot the Windows Server.
Now all locations are displayed (such as Outlook and/or OneNote). In addition, the number of indexed items should increase significantly.

Note: In Indexing Options > Advanced, the locations of the index can be specified and Rebuild if necessary.
Windows Search Indexing in Server 2019, 2022 using Multi-Session
Now, the default Windows Search service is able to roam all Windows Search index data on a per-user basis. The most significant change of per-user search indexing is that the Windows Search index is now stored per user in the user profile, under the following path:
C:\Users\%Username%\AppData\Roaming\Microsoft\Search\Data\Applications{UserSID}{UserSID}.edbOn each login, the Windows Search process creates a new instance of the search database for the user based on the existing EDB. If no EDB file exists, a new one is created by the Operating System.
Enable Windows Search Service on RDS Server
Log in to the Windows Server 2019 or 2022 and launch the Server Manager. Click Manage and select Add Roles and Features. Select Role based or feature-based installation option and click Next, walk through until the Features page, select the Windows Search Service checkbox and click Next. On the Confirmation page, click Install.
Now the windows search service just needs to be started, this is done from services.msc, open windows search properties, select startup type Automatic (Delayed Start), then click the Start button.

Install Windows Search Service in PowerShell
Using PowerShell is probably the quickest way to install the Windows Search service on a server. Launch the PowerShell as administrator. Run the following PowerShell command to install the Windows Search service on Windows Server.
Install-WindowsFeature Search-ServiceOpen Windows Indexing Options
To access the indexing options, enter “indexing” in the search field.
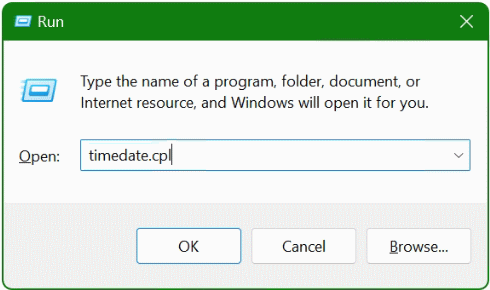
Alternatively, you can press the key combination Windows-Logo+R.
A new “Run” window will then open. Type the command control srchadmin.dll and select OK.

Windows Search Indexing
Indexing is the process of looking at files, email messages, and other content on your PC and RDS Server and cataloging their information, such as the words and metadata in them. When you search your Computer after indexing, it looks at an index of terms to find results faster.
When you first run indexing, it can take up to a couple hours to complete. After that, indexing will run in the background on your PC or RDS Server as you use it, only re-indexing updated data.
Note. if you are considering using single user search roaming or multi-user search roaming, follow this Microsoft article.