
This tutorial shows how to setup Xdebug 3 in WSL2 (Ubuntu 22.04) and VS Code on Windows 11
Most tips on the web for getting Xdebug to play with VS Code and WSL2 are using the php.ini settings from Xdebug 2, which is no longer supported by Xdebug 3.
let’s start Xdebug 3
First go to the Xdebug Installation Wizard. This page helps you finding which file to download, and how to configure PHP to get Xdebug running.
Next after Xdebug 3 is ready in WSL2 (Ubuntu), make sure the symlink file 99-xdebug.ini points to xdebug.ini.
cd /etc/php/8.2/cli/conf.d
ln -s /etc/php/8.2/mods-available/xdebug.ini 99-xdebug.ini
Edit the ini file using nano or vi/etc/php/8.2/cli/conf.d/99-xdebug.iniload the module last with 99.
[xdebug]
zend_extension = xdebug.so
xdebug.start_with_request = yes
xdebug.mode = debug
xdebug.discover_client_host = 1
xdebug.log = /var/log/xdebug.log
xdebug.client_port = 9003
If you are not familiar with the Linux shell, you can also access the WSL 2 file system from Windows to edit the xdebug.ini file. To do this, enter the following line in the explorer address bar to open the folder in which xdebug.ini is located.
\\wsl.localhost\Ubuntu\etc\php\8.2\mods-available
Note. here “Ubuntu” stands for my WSL instance, change it if necessary. The file 99-xdebug.ini is a symlink and points to xdebug.ini.
Enable remote debugging in your php.ini
Add these lines to the end of your php.ini. The path of your php.ini is shown in your phpinfo() output under “Loaded Configuration File”. Debian with php 8.2 the php.ini can be found in/etc/php/8.2/apache2/php.ini
[xdebug]
zend_extension = /usr/lib/php/20220829/xdebug.so
xdebug.mode = debug
xdebug.start_with_request = yes
xdebug.client_host = 127.0.0.1
xdebug.client_port = 9003
Note. the path for zend_extension it depends on the php version, change the path to the xdebug.so if necessary!
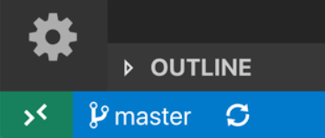
VS Code WSL and Xdebug extension
This extension is a debug adapter between VS Code and Xdebug by Derick Rethans. Xdebug is a PHP extension (a .so file on Linux and a .dll on Windows) that needs to be installed on your server. Now reopen the workspace/folder using the Remote – WSL extension. To do this, you can bring them up by pressing F1 to open the Command Palette and typing in WSL, or by selecting the green remote indicator in the lower left corner of the status bar and select “Connect to WSL“. You will probably see the suggestion that the WSL extension should be added, just confirm with yes.
 | 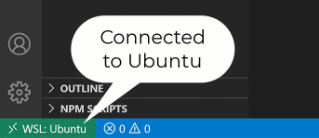 |
The WSL extension lets you use VS Code on Windows to build Linux applications that run on the Windows Subsystem for Linux (WSL). You get all the productivity of Windows while developing with Linux-based tools, runtimes, and utilities.
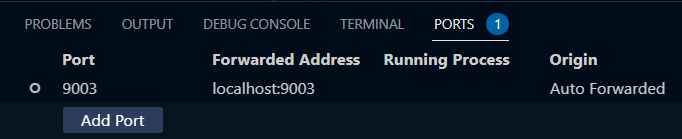
At the bottom right of the terminal pane you can see ports that forwarded to localhost port 9003, so VS Code interacts with Xdebug in WSL2.
Add Xdebug launch configuration
Now add PHP: Listen for Xdebug to the VS Code launch configuration with choose Run -> Open Configurations.
        {
            "name": "Listen for Xdebug",
            "type": "php",
            "request": "launch",
            "port": 9003,
            "stopOnEntry": true,
            "log": true,
            "pathMappings": {
                "/mnt/c/users/<userID>/documents/ubuntu": "${workspaceRoot}"
            }
        }
This the first section “Listen for Xdebug” is needed. If you want to try out more settings, go to my launch.json here.
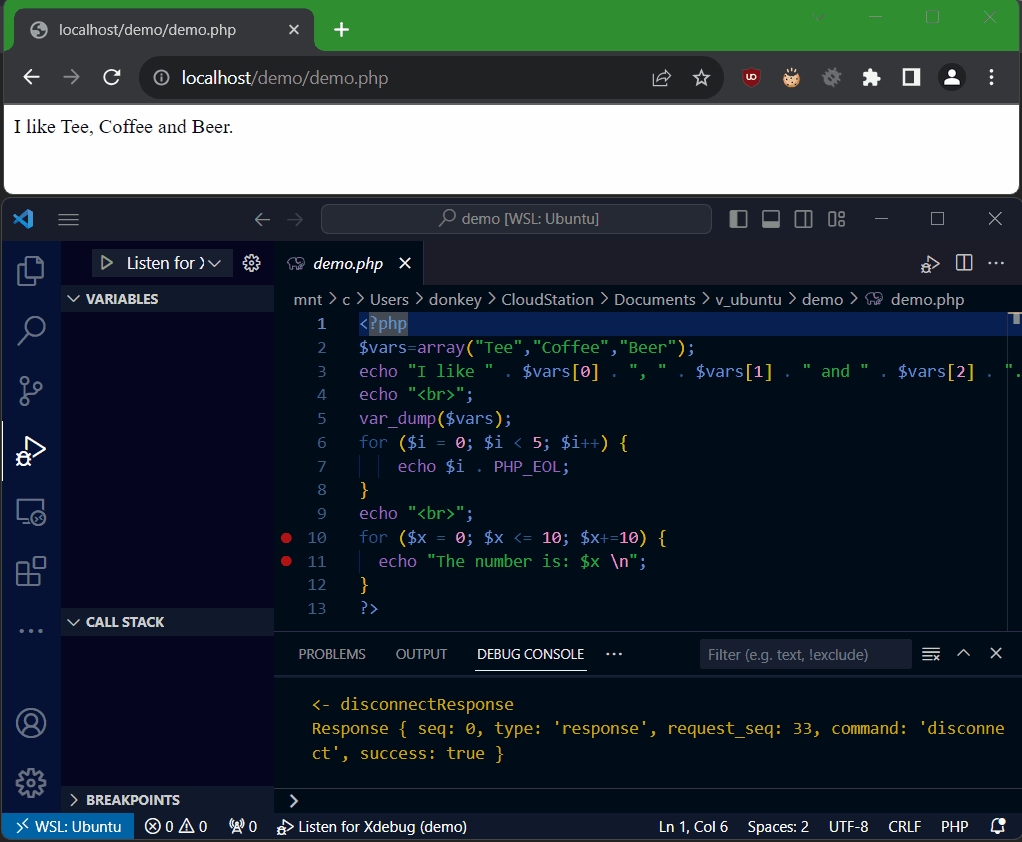
VS Code Run and Debug
Open the file for debugging in your browser and open it in VS Code, now go to Run and Debug with hit Ctrl+Shift+D and start Listen for Xdebug F5 or click the green arrow and reload the page from the browser.
A Chrome plugin called Xdebug helper which let you toggle debugging in chrome. You might want to skip temporarily debugging, it also provides profiling and tracing for Xdebug. This add-on is also available for Microsoft Edge did you can get here.
Finalize Xdebug in WSL2
Set the owner rights for the web server to the Xdebug log file.
$ chown www-data:www-data /var/log/xdebug.logDon’t forget to restart the Apache web server.
$ systemctl restart apache2Troubleshooting
If something went not as expected, the following commands can be helpful for troubleshooting.
How do I know if Xdebug is running? The next command should show the commonly output in the WSL2 Ubuntu.
$ php -v
PHP 8.2.12 (cli) (built: Oct 26 2023 17:33:49) (NTS)
Copyright (c) The PHP Group
Zend Engine v4.2.12, Copyright (c) Zend Technologies
    with Zend OPcache v8.2.12, Copyright (c), by Zend Technologies
    with Xdebug v3.2.2, Copyright (c) 2002-2023, by Derick Rethans
The PHP information php -i command shows the status of xdebug.
$ php -i | grep "xdebug.mode"
             Enabled Features (through 'xdebug.mode' setting)
xdebug.mode => debug => debug
Further can be checked that Xdebug is listening and ready in VSCode.
$ netstat -tulpen | grep LISTENIf Xdebug is set up correctly and running in VS Code, you should see the following output.
tcp      0    0 127.0.0.1:3306       0.0.0.0:*     LISTEN    110     23618    298/mariadbd
tcp      0    0 127.0.0.1:35883      0.0.0.0:*     LISTEN    1000    22932    800/node
tcp      0    0 127.0.0.53:53        0.0.0.0:*     LISTEN    101     17836    134/systemd-resolve
tcp6     0    0 :::9003              :::*          LISTEN    1000    17992    966/node
tcp6     0    0 :::80                :::*          LISTEN    0       19672    299/apache2
Port 9003 in particular should appear with LISTEN.
Check if Xdebug responds on localhost port 9003 and VSCode is ready to answer queries.
$ nc -vz 127.0.0.1 9003
Connection to 127.0.0.1 9003 port [tcp/*] succeeded!
If you get connection refused may VSCode is not listening!
The Xdebug log file provides information about the process activities.
$ tail -f /var/log/xdebug.logThe Windows firewall can also be temporarily deactivated if necessary.
Set-NetFirewallProfile -Profile Domain,Public,Private -Enabled FalseRun as administrator in the PowerShell.
Xdebug 3 and Visual Studio Code
The Lightweight Editor VS Code is a cross-platform editor for developers that differs from integrated development environments (IDE). Like Sublime or Eclipse, Visual Studio Code still supports debugging and autocompletion with IntelliSense. But it does not include integrated compilers and components such as version management.
However, Visual Studio Code makes it possible to adapt the environment (IDE) to the required development workflow. With a variety of extensions, so additional features can be integrated from the marketplace, such as the extension for Connect to WSL and Debug support for PHP with Xdebug. The PHP Hypertext Preprocessor must be provided according to the platform and version.


